Stay home is not a bad thing, watching the news every day reminds me of a project during my graduate study at NYU, which was an interesting research project I did during the 2016 election. I remember my classmates were staring at the screen to see the states turning into blue and red. When I got home, I came up with an idea with a Python project - sentimental analysis of detecting fake news.
This is a small project, the purpose is to give an idea of how to use Python to prepare our data, model it, and train it. If you're new to python, the concept would be a little bit advanced but worth giving it a try.
Step 1: Choose the Environment
You may choose any environment you prefer, in this blog, I’m going to use Jupyter Notebook, which is open-source and easy to install.
Open the terminal and run the command to install Jupyter Notebook:
pip install jupyterlabThen run the command to open it:
jupyter notebookNow you’ll see a new browser window open up; create a new console to start the project.
Find more installation options here.
Step 2: Explore the Dataset
Download it here. (Source from: Data flair)
File type: CSV
Size: 30M
Column: news_code, title, text and label(real/fake)
Step 3: Make some preparation for Python
Let’s make some imports first, then I’ll explain why we’re choosing these modules:
import pandas as pd
import numpy as np
import itertools
from sklearn.model_selection import train_test_split
from sklearn.feature_extraction.text import TfidfVectorizer
from sklearn.linear_model import PassiveAggressiveClassifier
from sklearn.metrics import accuracy_score, confusion_matrix
Before opening the csv file in python, I always check my current working directory to avoid some path errors occur later.
import os
cwd = os.getcwd()  # Get the current working directory
files = os.listdir(cwd)  # Get all the files in that directory
print("Files in %r: %s" % (cwd, files)) # Print the files under the current working directory
So, I can tell python where to locate my file.
news_df = pd.read_csv("Desktop/news.csv")
news_df.head()
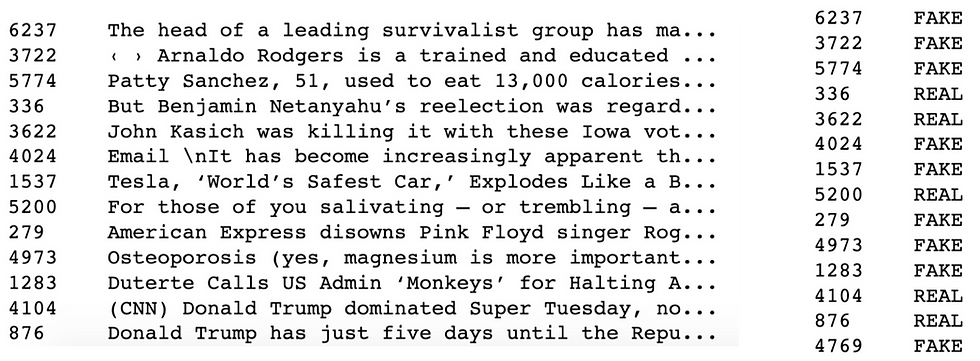
The dataset looks like this:

Step 4: Split the Dataset Into Training and Testing Subsets
x_train,x_test,y_train,y_test=train_test_split(news_df['text'], news_df['label'], test_size=0.2, random_state=7)The x_train, y_train data look like this:

Step 5: Start the Analysis
We are detecting fake news, so we need to clarify what is fake news and the feature of fake news.
What is fake news?
"Fake news (also known as junk news, pseudo-news, or hoax news) is a form of news consisting of deliberate disinformation or hoaxes spread via traditional news media (print and broadcast) or online social media. Digital news has brought back and increased the usage of fake news, or yellow journalism. Fake news is then often reverberated as misinformation on social media platforms and occasionally finds its way to the mainstream media as well."
--Wikipedia
Remember we made some imports from 'sklearn', which is a machine learning library built for Python to provide various algorithms. Find the website for more info.
Introduce to TF-IDF:
TF-IDF (term frequency–inverse document frequency) is a commonly used weighting technique for information retrieval and data mining. It is often used to mine keywords in articles, and the algorithm is simple and efficient.
Equation: Term Frequency (TF) = The number of times a word appears in a document / Total number of words
TF is The times of a word appears in a document. A term appears more often than others will be in a higher value. The document is a good match when the term is part of the search terms. Equation: Inverse Document Frequency (IDF) = log (The total number of documents in a corpus / the number of documents where the specific term appears +1)
🤪Yuchen's Explanation: IDF can be used to evaluate the importance of a word for a document in a corpus. The importance of a word increases proportionally with the number of times it appears in the document, but it also decreases inversely with the frequency of its appearance in the corpus. If a term is relatively rare, but it appears many times in this article, then it is likely to reflect the features of this article.
TF-IDF = TF x IDF
In summary, TF-IDF increases when a term frequently appears in the document, but decreases in the corpus.
a. Let's initialize TfidfVectorizer() by filtering some stop words (i.e is, and, a, the, for, etc). max_df is used to remove terms that appear too frequently, max_df = 0.7 means to remove terms that appear in more than 70% of the documents.
#Initialize TfidfVectorizer
tfidf_vectorizer=TfidfVectorizer(stop_words='english', max_df=0.7)
b. The next step is to fit and transform the train data (x_train) and transform the test data (x_test). Here we use fit_transform() to learn the vocabulary and IDF, then return the term-document matrix.
#Fit and transform train data set
tfidf_train=tfidf_vectorizer.fit_transform(x_train)
#transform test set to term-document matrix/Perform standardization by centering and scaling
tfidf_test=tfidf_vectorizer.transform(x_test)
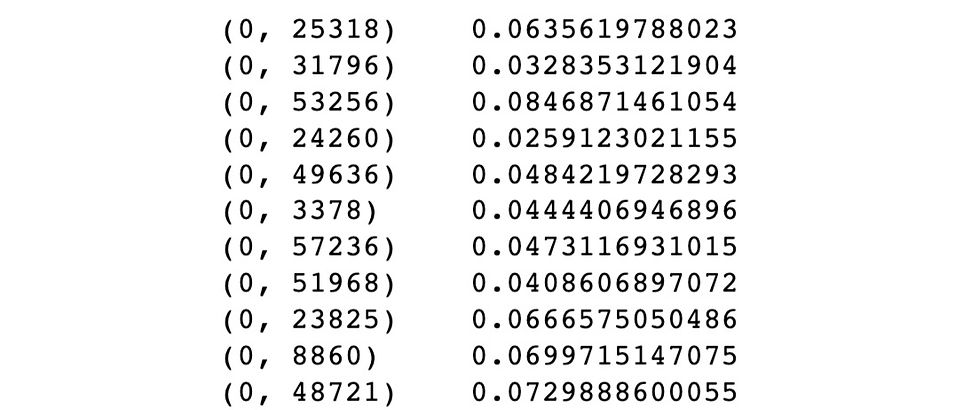
If we print the train data, the output will be:

The tuple represents (document_id, token_id), and the number following the tuple represents the TF-IDF score of the token in the document.
c. We use PassiveAggressiveClassifier for classification:
pac=PassiveAggressiveClassifier()
pac.fit(tfidf_train,y_train)
# Make prediction on the test set
y_pred=pac.predict(tfidf_test)
The science behind this algorithm is not very difficult to get, please check this article to explore more.
d. Then we'll calculate the accuracy using accuracy_score()
score=accuracy_score(y_test,y_pred)
print(f'Accuracy: {score}')
Great, we got 92.6% accuracy of our model!
e. Build confusion matrix:
# Build confusion matrix
cf_matrix = confusion_matrix(y_test,y_pred, labels=['FAKE','REAL'])
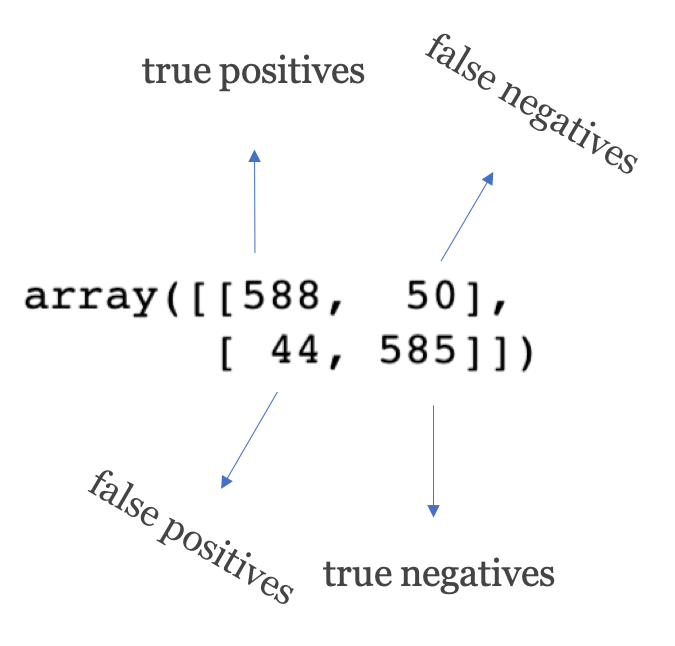
cf_matrix
The confusion matrix visualizes the performance of a classification model. Let's see what we got here:

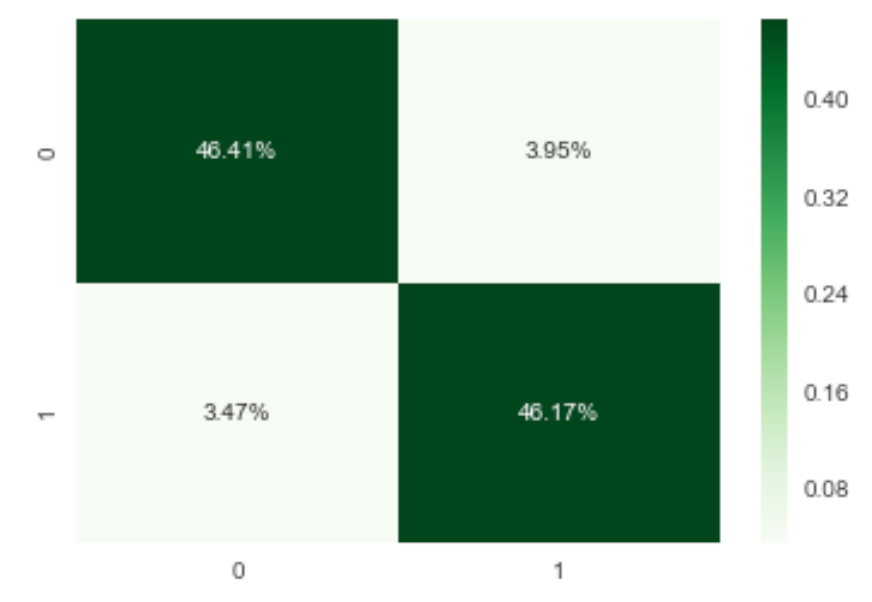
To make the confusion matrix neat and meaningful, we can do some makeups here:
Viz_cf_matrix = sns.heatmap(cf_matrix/np.sum(cf_matrix), annot=True, fmt='.2%', cmap='Greens')
Summary
In this blog, we discussed how we build a model of detecting fake news with Python. We explored a csv file with political news, applied TF-IDF to vectorize the keywords and fit the model with PassiveAggressiveClassifier. We ended up with roughly 92.6% accuracy and visualized the confusion matrix to show the performance of the model.
This was an interesting python project and coved some basic knowledge of machine learning. Machine learning is a huge topic, I hope this blog can give you a tiny bit concept of how predictive models are used in the real world.
🤪Stay home and keep analyzing!

Comments